1. Introduction
2. Toolbar
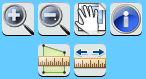
The toolbar that will be discussed in this article consist of the following toolbar items :
· Zoom In tool
· Zoom out tool
· Pan command
· Inspect tool
· Measure tools
All these tools and commands have their main implementation in the common ViewModel but have a more detailed implementation in a ‘common toolbar’ ViewModel. Doing so, the main ViewModel is a light weight class with little or no logic behind, and it sole purpose is to interact with the view (the html page). New here is also the use of templates from the knockoutJS javascript library.
To make debugging easier, I introduced a logging component. The logging happens through a rest service and is stored in a log file at the server. This approach can be useful to trace all errors that occurs in the application. However for debugging purpose this can also be very useful. Because a lot of methods works asynchronous, having an extended log file can help you debug errors due to inconsistent sequence of operations. Below you can see an example of a log file. I use a debug variable to enable or disable extended logging. Important is adding logging when asynchronous actions occurs. As you can see in de log file example, initialization does not always happens in the sequence of the call to the rest services.
24/04/2012 - 18:05:30 - I - startup -
getconfiguration start
24/04/2012 - 18:05:30 - I - startup -
getconfiguration finished
24/04/2012 - 18:05:30 - I -
eventAggregator-subscribe - mapLoaded
24/04/2012 - 18:05:30 - I -
eventAggregator-subscribe - legendBuild
24/04/2012 - 18:05:30 - I -
addNewDynamicLayer -
http://services.arcgisonline.com/ArcGIS/rest/services/World_Topo_Map/MapServer
24/04/2012 - 18:05:30 - I - addNewDynamicLayer
-
http://services.arcgisonline.com/ArcGIS/rest/services/World_Street_Map/MapServer
24/04/2012 - 18:05:30 - I - mapModule -
init finished
24/04/2012 - 18:05:30 - I - startup -
startup finished
24/04/2012 - 18:05:30 - I -
layer_Initialized - http://services.arcgisonline.com/ArcGIS/rest/services/World_Topo_Map/MapServer
24/04/2012 - 18:05:30 - I -
addNewFeatureLayer -
http://sampleserver3.arcgisonline.com/ArcGIS/rest/services/Fire/Sheep/FeatureServer/0
24/04/2012 - 18:05:30 - I -
addNewFeatureLayer -
http://sampleserver3.arcgisonline.com/ArcGIS/rest/services/Fire/Sheep/FeatureServer/1
24/04/2012 - 18:05:30 - I -
layer_Initialized -
http://services.arcgisonline.com/ArcGIS/rest/services/World_Street_Map/MapServer
24/04/2012 - 18:05:31 - I - featureLayer_Initialized
-
http://sampleserver3.arcgisonline.com/ArcGIS/rest/services/Fire/Sheep/FeatureServer/1
24/04/2012 - 18:05:31 - I -
featureLayer_Initialized -
http://sampleserver3.arcgisonline.com/ArcGIS/rest/services/Fire/Sheep/FeatureServer/0
24/04/2012 - 18:05:31 - I -
eventAggregator-publish - mapLoaded - initializeVM
24/04/2012 - 18:05:31 - I -
eventAggregator-publish - mapLoaded - legendBuild
24/04/2012 - 18:05:31 - I - legendModule -
start legend build
24/04/2012 - 18:05:33 - I - legendModule -
build legend done
24/04/2012 - 18:05:33 - I -
eventAggregator-publish - legendBuild - selectBuild
|
4. Navigation tools
The migration of the Silverlight C# implementation of Zoom in and Zoom out is very easy. As you can see by comparing the two implementations, a lot of coding is similar between C# and JavaScript.
Button commands
///
<summary>
///
Zoom In task
///
</summary>
zoomInTask: function
() {
currentCommand = "ZoomIn";
iGisOperation.setCompleteDrawEvent(drawComplete);
iGisOperation.setDrawMode(esri.toolbars.Draw.EXTENT);
// Start draw tool with a rectangle
},
///
<summary>
///
Zoom Out task
///
</summary>
zoomOutTask: function
() {
currentCommand = "ZoomOut";
iGisOperation.setCompleteDrawEvent(drawComplete);
iGisOperation.setDrawMode(esri.toolbars.Draw.EXTENT); // Start draw tool with a rectangle
}
|
/// <summary>
/// Zoom
In task
/// </summary>
public void
ZoomInTask()
{
currentCommand = "ZoomIn";
gisOperations.SetCompleteDrawEvent(DrawComplete);
gisOperations.SetDrawMode(DrawMode.Rectangle); //
Start draw tool with a rectangle
}
/// <summary>
/// Zoom
out task
/// </summary>
public void
ZoomOutTask()
{
currentCommand = "ZoomOut";
gisOperations.SetCompleteDrawEvent(DrawComplete);
gisOperations.SetDrawMode(DrawMode.Rectangle); //
Start draw tool with a rectangle
}
|
JavaScript code
iGisOperation.mapZoom(currentCommand,
args.getExtent());iGisOperations.setDrawMode(esri.toolbars.Draw.EXTENT);
C# code
gisOperations.MapZoom(currentCommand, args.Geometry);
gisOperations.SetDrawMode(DrawMode.Rectangle);
Next I use the zoom in the map method, this
is the main method used for the zoom in and the zoom out actions. Below is the comparison
between the JavaScript and C# code.
Zoom action
JavaScript Code
mapZoom: function (action, geometry) {
try {
var
multiplier;
if (action == "ZoomIn") {
map.setExtent(geometry.getExtent());
}
Else if
(action == "ZoomOut") {
var
currentExtent = map.extent;
var
zoomBoxExtent = geometry.getExtent();
var
zoomBoxCenter = zoomBoxExtent.getCenter();
var
whRatioCurrent = currentExtent.getWidth() / currentExtent.getHeight();
var
whRatioZoomBox = zoomBoxExtent.getWidth() / zoomBoxExtent.getHeight();
var
newEnv = null;
if
(whRatioZoomBox > whRatioCurrent) {
//
use width
multiplier =
currentExtent.getWidth() / zoomBoxExtent.getWidth();
var
newWidthMapUnits = currentExtent.getWidth() * multiplier;
newEnv = new
esri.geometry.Extent(zoomBoxCenter.x - (newWidthMapUnits / 2), zoomBoxCenter.y,
zoomBoxCenter.x + (newWidthMapUnits /
2), zoomBoxCenter.y, map.spatialReference);
}
else
{
// use
height
multiplier =
currentExtent.getHeight() / zoomBoxExtent.getHeight();
var
newHeightMapUnits = currentExtent.getHeight() * multiplier;
newEnv = new
esri.geometry.Extent(zoomBoxCenter.x, zoomBoxCenter.y - (newHeightMapUnits
/ 2),
zoomBoxCenter.x, zoomBoxCenter.y +
(newHeightMapUnits / 2), map.spatialReference);
}
if
(newEnv != null)
map.setExtent(newEnv.getExtent());
}
} catch
(e) {
throw
new Error("zoom
action failed. " + e.name + "\n"
+ e.message);
}
}
|
/// <summary>
/// Zoom
in and out task
/// </summary>
/// <param
name="action">ZoomIn or ZoomOut</param>
/// <param
name="geometry">Rectangle to be zoomed</param>
public void MapZoom(string
action, ESRI.ArcGIS.Client.Geometry.Geometry
geometry)
{
try
{
if
(action.Equals("ZoomIn"))
{
mapControl.ZoomTo(geometry as Envelope);
}
Else
if (action.Equals("ZoomOut"))
{
Envelope currentExtent =
mapControl.Extent;
Envelope zoomBoxExtent =
geometry as Envelope;
MapPoint zoomBoxCenter = zoomBoxExtent.GetCenter();
double
whRatioCurrent = currentExtent.Width / currentExtent.Height;
double whRatioZoomBox =
zoomBoxExtent.Width / zoomBoxExtent.Height;
Envelope newEnv = null;
if (whRatioZoomBox >
whRatioCurrent)
// use width
{
double
multiplier = currentExtent.Width / zoomBoxExtent.Width;
double newWidthMapUnits
= currentExtent.Width * multiplier;
newEnv = new Envelope(new MapPoint(zoomBoxCenter.X - (newWidthMapUnits
/ 2), zoomBoxCenter.Y),
new MapPoint(zoomBoxCenter.X
+ (newWidthMapUnits / 2), zoomBoxCenter.Y));
}
else
// use height
{
double multiplier =
currentExtent.Height / zoomBoxExtent.Height;
double newHeightMapUnits =
currentExtent.Height * multiplier;
newEnv = new Envelope(new MapPoint(zoomBoxCenter.X, zoomBoxCenter.Y -
(newHeightMapUnits / 2)),
new MapPoint(zoomBoxCenter.X,
zoomBoxCenter.Y + (newHeightMapUnits / 2)));
}
if (newEnv != null)
mapControl.ZoomTo(newEnv);
}
}
catch (Exception ex)
{
messageBoxCustom.Show(String.Format("MapZoom-{0}",
ex.Message),
GisTexts.SevereError,MessageBoxCustomEnum.MessageBoxButtonCustom.Ok);
}
}
|
5. Inspect tool
With the inspect tool we come to a more sophisticated tool. The inspect tool will retrieve all features that intersects with the point indicated on the map using a predefined buffer. The layers used on the map for the query must be checked on the selection tab of the tab control. The results containing the attributes will be displayed on the query tab. To simplify the display, I used a html embedded template of knockoutJS that make use of dependency properties of the ViewModel easy to show.
Step 1 : Start a draw action of a point selection.
infoCommand: function () {
try {
iGisOperation.getMeasurement().clearResult();
iGisCommonTasks.setFinishedInfoEvent(handleInfoResults);
iGisCommonTasks.infoQuery(true);
} catch
(e) {
logMessage("E",
"IQ-01", e.Message);
}
}
|
infoQuery: function (isSpatialQuery) {
//
Info implementation , using ESRI API
iGisOperation.resetCompleteDrawEvent(drawComplete);
if
(isSpatialQuery)
currentCommand = "Info";
else
currentCommand = "AddressInfo";
iGisOperation.setCompleteDrawEvent(drawComplete);
iGisOperation.setDrawMode(esri.toolbars.Draw.POINT);
}
|
if (currentCommand
== "Info" || currentCommand ==
"AddressInfo") {
// Use
ESRI API for Info
var
layer = null;
var i;
var
query, queryTask;
iGisOperation.setDrawMode(null);
iGisOperation.resetCompleteDrawEvent();
result = new
Array();
errorCount = 0;
errorMessages = '';
totalCountLayers = 0;
currentCountLayers = 0;
if
(currentCommand == "Info") {
totalCountLayers =
iGisOperation.getLayersSelectionInfos().length;
for (i
= 0; i < iGisOperation.getLayersSelectionInfos().length; i++) {
if
(iGisOperation.getLayersSelectionInfos()[i].selected &&
iGisOperation.getLayersSelectionInfos()[i].layer.type == 'Feature Layer') {
queryTask = new
esri.tasks.QueryTask(iGisOperation.getLayersSelectionInfos()[i].url);
query = new
esri.tasks.Query();
query.geometry = args;
query.outFields = ["*"];
query.spatialRelationship =
esri.tasks.SPATIAL_REL_INTERSECTS;
queryTask.execute(query, function (features) {
currentCountLayers += 1;
if
(!features.name) {
if
(features.features.length > 0)
result.push(features);
}
queryInfosComplete();
}, function
(e) {
currentCountLayers += 1;
errorCount += 1;
errorMessages += ">";
errorMessages += e.message;
errorMessages += "\n";
queryInfosComplete();
});
}
else
currentCountLayers += 1;
}
}
|
function
queryInfosComplete() {
if
(currentCountLayers >= totalCountLayers) {
if
(finishedInfoOperation != null)
finishedInfoOperation(result);
}
}
|
var
attributesResults;
var
currentItem;
function
handleInfoResults(results) {
try
{
iGisCommonTasks.setFinishedInfoEvent(null);
attributesResults = new Array();
var
attributeItem;
for
(var i = 0; i < results.length; i++) {
var
resultFeatures = results[i].features;
for
(var j = 0; j < resultFeatures.length;
j++) {
var attributes = new
Array();
for (var item in resultFeatures[j].attributes) {
attributeItem =
new attribute(ko.observable(item),
ko.observable(resultFeatures[j].attributes[item]));
attributes.push(attributeItem);
}
attributesResults.push(attributes);
}
}
if
(attributesResults.length > 0) {
viewModel.resultAttributes(attributesResults[0]);
viewModel.resultCount((attributesResults.length));
currentItem = 1;
viewModel.resultIndex(currentItem);
viewModel.resultVisible(true);
}
else
{
alert("No results found");
}
} catch
(e) {
logMessage("E", "error
in handleInfoResults->" + e.name + "\n"
+ e.message, "commonToolbarVM");
}
}
|
Two buttons are used to scroll through the results. The query tab looks like the example below.

The html code that is used for displaying
the result above with the knockoutJS data binding is :
<div id="queryResults"
data-bind="visible:
resultVisible">
<table class="tableResult">
<thead ><span data-bind="text: resultHeader" style="font-size:medium"/>
<th scope="col">Field</th>
<th scope="col">Value</th>
</thead>
<tbody data-bind="foreach: resultAttributes">
<tr>
<td data-bind="text: field">
</td>
<td data-bind="text: value">
</td>
</tr>
</tbody>
</table>
<input id="nextResult" type="button" value="Next" data-bind="click: nextResultExecute, enable:
nextResultCanExecute" />
<input id="prevResult" type="button" value="Previous" data-bind="click: prevResultExecute, enable:
prevResultCanExecute" />
<input id="closeResult" type="button" value="Close"
data-bind="click:
closeResultExecute, enable: closeResultCanExecute" />
</div>
|
In JavaScript the job is much harder if you
don’t want to use the ESRI widget and create your own button implementation.
Creation of a custom measurement consist of the following steps:
·
Add the measurement widget to
the html page during the onload event of the map.· Activate the measure tools through button commands.
· In the callback method the geometry drawn is returned.
· Call the geometry service for calculating area and length of the drawn geometry.
· Return the values to the ViewModel for displaying .
Step : Add measurement widget in the init method of the map module
dojo.connect(mapControl, 'onLoad', function
(map) {
//resize
the map when the browser resizes
dojo.connect(dijit.byId('map'), 'resize',
map, map.resize);
initToolbar(map);
});
|
measureCommand: function (tool) {
iGisOperation.getMeasurement().clearResult();
iGisOperation.getMeasurement().setTool(tool, true);
dojo.connect(iGisOperation.getMeasurement(), "onMeasureEnd", function
(activeTool, geometry) {
this.setTool(activeTool,
false);
//
calcuate the area or length of the geometry
if
(activeTool == "area") {
iGisGeoProcessing.calculateAreaLength(geometry,
function
calcResults(areaPolygon,
lenPolygon) {
if
(areaPolygon != null)
viewModel.message1("Area is "
+ areaPolygon.toFixed(0) + " m2 and the
length is " + lenPolygon.toFixed(0) + "
m");
else
viewModel.message1("Error occured during the calculation, see log
file");
});
}
else
if (activeTool == "distance")
{
iGisGeoProcessing.calculateLength(geometry,
function calcResults(lenPolyline) {
if
(lenPolyline != null)
viewModel.message1("Length is " + lenPolyline.toFixed(0)
+ " m");
else
viewModel.message1("Error occured during the calculation, see log
file");
});
}
});
}
|
Two methods are added to the geo processing
class to calculate the area and / or length of geometries. Later I will add
more methods to this class for supporting the feature editing to
calculateAreaLength:
function (geometry, callBack) {
var
areasAndLengthParams = new esri.tasks.AreasAndLengthsParameters();
areasAndLengthParams.lengthUnit =
esri.tasks.GeometryService.UNIT_METER;
areasAndLengthParams.areaUnit =
esri.tasks.GeometryService.UNIT_METERS;
iGisOperation.getGeometryService().simplify([geometry],
function
(simplifiedGeometries) {
areasAndLengthParams.polygons =
simplifiedGeometries;
iGisOperation.getGeometryService().areasAndLengths(areasAndLengthParams,
function
outputAreaAndLength(result) {
var
areaPolygon = result.areas[0];
callBack(result.areas[0],
result.lengths[0]);
}, function
errorAreaLength(err) {
logMessage("E", "calculate
area failed -->" + err.message, "commonToolbarVM");
callBack(null,null);
});
});
}
|
By implementing these tools we already touched a lot of geometry processing. In the case of the inspect tool, I discover one important difference when executing spatial queries. In the Silverlight API you can add a tag to the query, so when the results are returned from the query, the tag can be used to identify the result set. In the JavaScript API, no tag can be added to the query. The result of this is that I could not identify the origin (layer) from the features. I will later see if there is a way to work around this lack of information in the JavaScript API.
The use of geometry services will play an
important role when we start to do feature editing. In the next document I will
introduce some basic editing functionality.